Difference between revisions of "Reduction of Surface Infiltration"
From GARDGuide
(→Reduction of Surface Infiltration Through Use of Geophysical Methods and Grouting) |
|||
| Line 5: | Line 5: | ||
Geophysical instruments can be used to locate the areas where significant amounts of water are disappearing underground (Figures 1 and 2). Then small holes can be drilled or hammered into the stream less than 1 m into the rock beneath the sediment, and used to inject grout beneath the streambed (Figure 3). The approach has restored 85 - 100% of stream flow, and has even been used to reduce infiltration into active mining operations. The effectiveness of this approach is illustrated in Figure 4. | Geophysical instruments can be used to locate the areas where significant amounts of water are disappearing underground (Figures 1 and 2). Then small holes can be drilled or hammered into the stream less than 1 m into the rock beneath the sediment, and used to inject grout beneath the streambed (Figure 3). The approach has restored 85 - 100% of stream flow, and has even been used to reduce infiltration into active mining operations. The effectiveness of this approach is illustrated in Figure 4. | ||
| − | <div style="text-align:center">'''Figure 1. | + | <div style="text-align:center">'''Figure 1. A two-person version of terrain conductivity being used to locate where stream water is leaving the streambed'''<br />[[Image:TerrainConductivity_.jpg]]</div> |
| − | |||
| − | |||
| − | Figure 4. The two graphs show how the conductivity peak has virtually disappeared and how flow has been restored across the formerly damaged streambed. | + | <div style="text-align:center">'''Figure 2. Another way of measuring terrain conductivity to identify where water is leaving the streambed, and a graph presenting the results. The peaks <br />represent areas of high conductivity where the water is infiltrating.'''<br />[[Image:Anotherwayofmeasuringterrainconductivity.jpg]]</div> |
| + | |||
| + | |||
| + | |||
| + | <div style="text-align:center">'''Figure 3. Grout being injected into the stream bed.'''<br />[[Image:Groutbeinginjectedintothestreambed.jpg]]</div> | ||
| + | |||
| + | |||
| + | |||
| + | <div style="text-align:center">'''Figure 4. The two graphs show how the conductivity peak has virtually disappeared and <br />how flow has been restored across the formerly damaged streambed.'''<br />[[Image:conductivitypeakhasvirtuallydisappeared.jpg]]</div> | ||
Revision as of 19:02, 12 June 2009
Reduction of Surface Infiltration Through Use of Geophysical Methods and Grouting
This page is a placeholder to be completed during June 2009
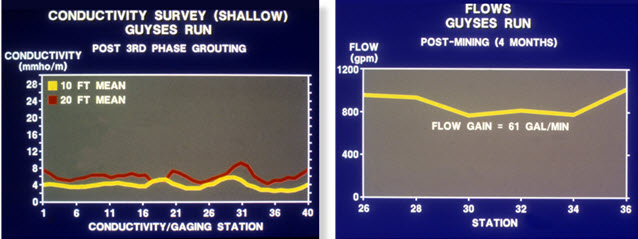
Geophysical instruments can be used to locate the areas where significant amounts of water are disappearing underground (Figures 1 and 2). Then small holes can be drilled or hammered into the stream less than 1 m into the rock beneath the sediment, and used to inject grout beneath the streambed (Figure 3). The approach has restored 85 - 100% of stream flow, and has even been used to reduce infiltration into active mining operations. The effectiveness of this approach is illustrated in Figure 4.
Figure 1. A two-person version of terrain conductivity being used to locate where stream water is leaving the streambed
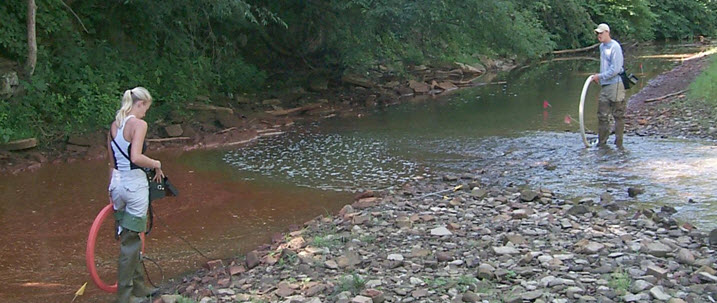

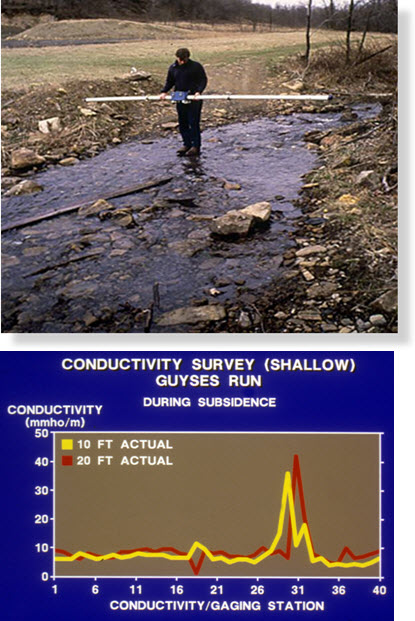
Figure 2. Another way of measuring terrain conductivity to identify where water is leaving the streambed, and a graph presenting the results. The peaks
represent areas of high conductivity where the water is infiltrating.
represent areas of high conductivity where the water is infiltrating.

Figure 3. Grout being injected into the stream bed.
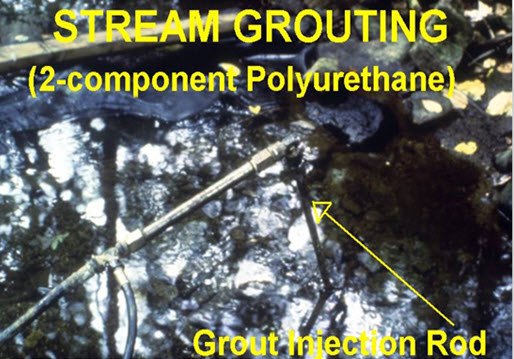

Figure 4. The two graphs show how the conductivity peak has virtually disappeared and
how flow has been restored across the formerly damaged streambed.
how flow has been restored across the formerly damaged streambed.
